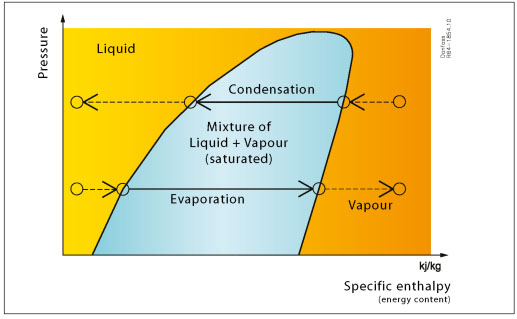
Characteristics of the refrigerant can be illustrated in the diagram using the primary characteristics as the abscissa and ordinate. For cooling systems of the main properties is usually chosen as the energy content and pressure. The energy content is presented to the thermodynamic properties of specific enthalpy, quantifying changes in energy content per unit mass of the refrigerant as it is undergoing processes in the cooling system. An example of a chart based on the specific enthalpy (abscissa) and pressure (ordinate) can be seen below. For cooler typically applicable interval to pressure large and therefore the schemes use a logarithmic scale pressure.
The scheme is designed so that it displays the liquid, the mixture of vapour and regions for the refrigerant. Liquid is left (low energy content) - pair to the right (with high energy content). Between them you will find a mixture of the region. Regions, limited curve called the saturation curve. Fundamental processes of evaporation and condensation are illustrated.
The idea of using refrigerant scheme is that it allows us to represent the processes occurring in the cooling system so that the analysis and evaluation of the process becomes easy.
When applying the system of determining the operating conditions (temperature and pressure) cooling system can be found in a relatively simple and quick way.
The scheme is still used as the main tool for the analysis of process of cooling. However, a number of PC programs that can perform the same analysis faster and more details were made public.
 ..
..