|
|
The psychrometric chart
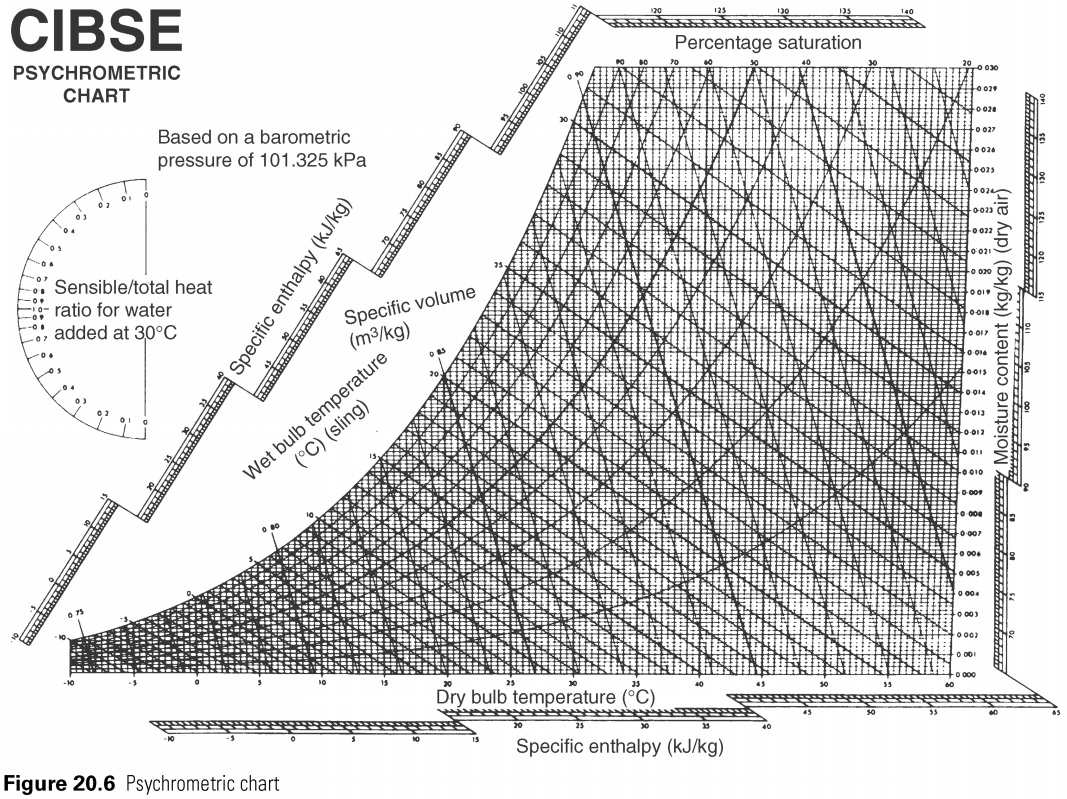
All of the above properties can be summarized in a table, but can be displayed more effectively in graphical form. The basic properties are shown dry bulb temperature, humidity and the specific enthalpy. In the framework of the schedule needed to conventional air conditioning processes, the grid can be assumed as a parallel and form the basis of the psychrometric diagram (Fig. 20.5). (It will be seen from the full chart, Fig. 20.6 that D.B. lines slightly divergent. The moisture content of the enthalpy networks parallel.)
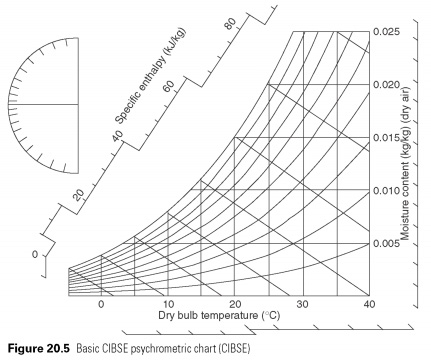
In this diagram, the wet bulb temperature are displayed as diagonal lines, which coincides with the dry bulb on the saturation line. If measurements are made with two thermometers sling psychrometer, conditions may be drawn on the psychrometric diagram, taking the intersection of the dry bulb temperature, as read vertically, with the wet bulb temperature, and read down diagonally across wet lines.
Specific enthalpy increase from dry bulb (sensible heat air) and humidity (sensible and latent heat, water).
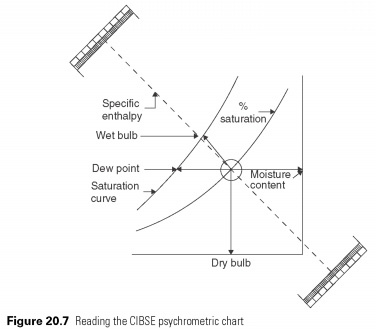
Adiabatic (iso-enthalpic) lines for air-water vapor mixture almost in parallel with the wet line, so to avoid any confusion, enthalpy scale is outside the body chart, and readings should be taken using a straight-edge (see Fig. 20.7).
Another property, which is shown in the psychrometric chart the specific volume of the mixture is measured in cubic metres per kilogram. It looks like a series of diagonal lines, with an interval of 0.01 m3...
|


